


Interactive Maps & Charts
Background
A peace-building think tank in collaboration with a leading international development organization wanted to design and build an interactive online interface for their statistical tool.
Objectives
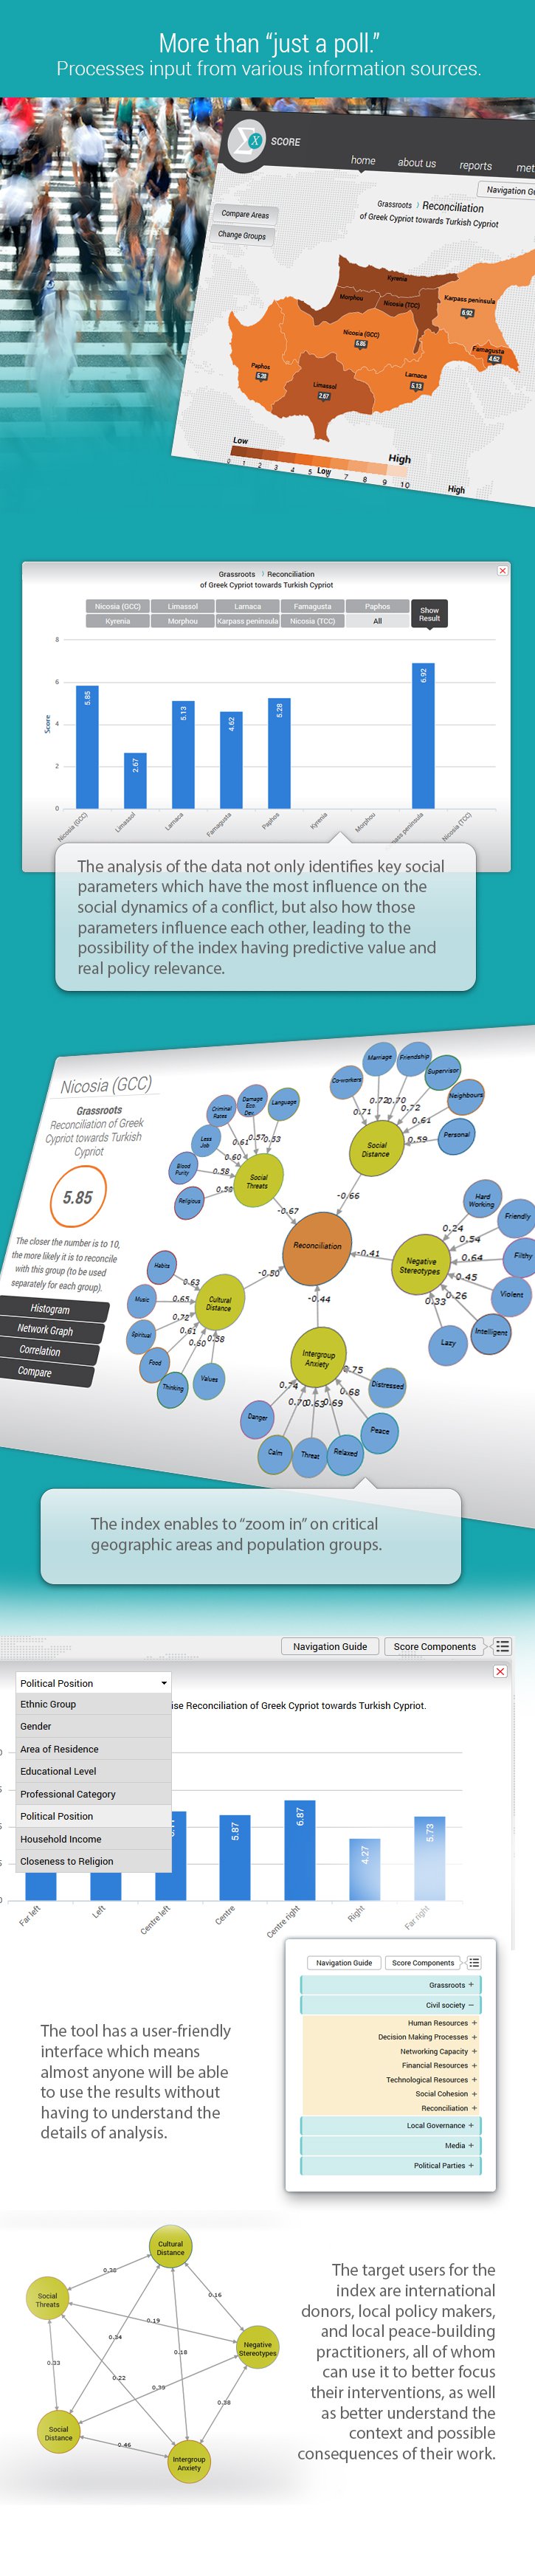
Design an online interface to present the results of a statistical tool used to measure and monitor changes in communities.
Analyze and present data drawn from various sources (polling, interviews, media analysis etc.) and then compile on a scale of 1 to 9.
Build an interactive map with the ability to upload data and link to various geographic points of the map.
Make comparisons of results with previous years, or with other countries.
Let's help you know more about PanKM
Please email us at inquiry@panapps.co